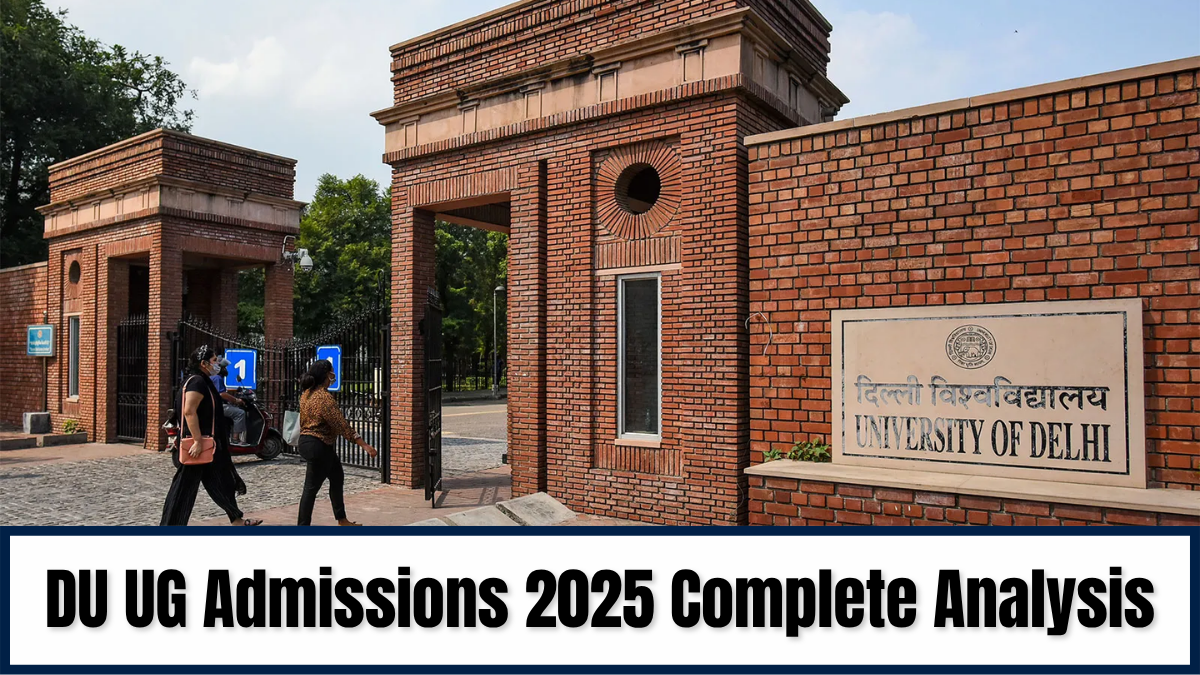
DU Admissions 2025: The University of Delhi, called the Delhi University (DU), has published the DU UG (Delhi University Undergraduate) Admission 2025 first round data on its official website. The admissions are conducted via the Common Seat Allocation System (CSAS).
The data shows that the commerce subjects, namely BCom and BCom Hons, are the most preferred courses, in contrast to the top preferred streams in aggregate being humanities, followed by commerce and then science. The top preferred college is SRCC among the 69 total colleges across the university.
DU UG Admission 2025 Overview
The following table contains the important data released by the Delhi University:
| Overview | Details |
| University name | University of Delhi Delhi University (DU) |
| Admission level | Undergraduate |
| Admission portal | Common Seat Allocation System (CSAS). |
| Admissions began | June 17, 2025 |
| Admission criteria | Scores from CUET UG 2025 |
| Total seats | 71,642 |
| Programmes | 79 |
| Colleges | 69 |
DU Admissions 2025: Admission Data Diversity
The Delhi varsity saw a record number of preferences submitted by candidates in this academic session. Here is a summary of the variety of applications received by the University of Delhi 2025-26 admissions:
| Metric | Value |
| Number of Signups | 3,05,357 |
| Total Preferences Submitted | 2,39,890 |
| Unique College + Program Preferences Received | 1,68,36,462 |
| Female Applications | 1,27,284 (53.06%) |
| Male Applications | 1,12,603 (46.93%) |
| Transgender Applications | 3 |
| Applicants for Orphan Quota | 512 (221 Female and 291 Male) |
| Applicants for Single Girl Child Quota | 7,243 |
| Maximum Preferences by a Single Candidate | 1,414 out of 1,549 combinations |
| Average Preferences per Candidate | 83 |
DU Admissions 2025: More Women than Men Seeking Admissions in 2025
Related Stories
This year saw a growth in the number of women participation in the undergraduate university admissions, recording a total of 53.06% as compared to 46.93% by men.
| Category | Number of Candidates |
| Total registered on CSAS portal | 3,05,357 |
| Total completed application process | 2,39,890 |
| Women candidates | 1,27,284 |
| Male candidates | 1,12,603 |
DU Admissions 2025: Which is the Most Preferred Courses across the University?
This year, in academic year 2025026 admissions season, the university saw an impressive growth in the preference of students are the following mentioned subjects:
| Programmes | Total Preferences |
| BCom (Hons.) | 19,90,966 |
| BCom | 15,26,403 |
| BA (Hons.) English | 12,23,388 |
| BA (Hons.) Political Science | 9,96,868 |
| BA (Hons.) History | 7,72,029 |
Also Read: Manipur HSLC Supplementary Result 2025
DU Admissions 2025: BCom Hons leading the Most Preferred Course across the University
This year, the maximum share of students are opting BCom honours course in their undergraduate admissions in the university, with a total of 48,336 applications only for the course as the first preference. The second-most preferred course being BA Political Science with 15 thousand first-preference applications. The following table carries the rest of top chosen courses:
| Programme | First-Preference Count |
| BCom (Hons) | 48,336 |
| BA (Hons) Political Science | 15,295 |
| BSc (Hons) Zoology | 12,722 |
| BTech Mathematics and Humanities | 10,584 |
| BCom | 8,939 |
DU Admissions 2025: North Campus Dominating, SRCC attracting the Most Students, followed by Hindu
According to the data shared by the university, the students in this academic session leaned towards the north campus colleges, with Sri Ram College of Commerce (SRCC) attracting the most first-preference applications, followed by Hindu College, Hansraj and the rest following.
| College | First-Preference Count |
| Shri Ram College of Commerce (SRCC) | 38,795 |
| Hindu College | 31,901 |
| Hansraj College | 15,902 |
| St. Stephen's College | 12,413 |
| Miranda House | 11,403 |
Also Read: MHT CET CAP 2025 Admissions
DU Admissions 2025: Humanities ruling as the Most Chosen Stream
This year’s admissions saw an increase in the number of admissions in the humanities stream, followed by commerce and science.
| Stream | Subject Combination | Number of Applications |
| Bachelor of Arts | History + Political Science | 7,60,233 |
| Bachelor of Arts | Economics + Political Science | 3,88,407 |
| Bachelor of Arts | English + Economics | 3,49,367 |
The university also records a preference of the humanities stream over the other two, following the similar pattern in the course selection preferences, as mentioned below:
| Stream | Percentage of Candidates |
| Humanities-based programs | 58.89% |
| Commerce-based programs | 20.89% |
| Science-based programs | 20.22% |
For latest education news, follow Jagran Josh.
To stay updated on current trends, join the Jagran Josh Telegram Community!

Comments
All Comments (0)
Join the conversation